SpringBoot 整合 Actuator 监控状态
转载自 Spring Boot Actuator 模块 详解:健康检查,度量,指标收集和监控 参考资料 Spring Boot Actuator监控使用详解
什么是 Actuator?
Spring Boot 内置了一个监控功能,它叫 Actuator。Spring Boot 的 Actuator 提供了很多生产级的特性,比如监控和度量 Spring Boot 应用程序。Actuator 的这些特性可以通过众多 REST 接口、远程 shell 和 JMX 获得。
因为暴露内部信息的特性,Actuator 也可以和一些外部的应用监控系统整合(Prometheus, Graphite, DataDog, Influx, Wavefront, New Relic等)。这些监控系统提供了出色的仪表板,图形,分析和警报,可帮助你通过一个统一友好的界面,监视和管理你的应用程序。
Actuator 使用 Micrometer 与这些外部应用程序监视系统集成。这样一来,只需很少的配置即可轻松集成外部的监控系统。
Micrometer 为 Java 平台上的性能数据收集提供了一个通用的 API,应用程序只需要使用 Micrometer 的通用 API 来收集性能指标即可。Micrometer 会负责完成与不同监控系统的适配工作。这就使得切换监控系统变得很容易。 对比 Slf4j 之于 Java Logger 中的定位。
总之,这个 Spring Boot Actuator 就是一个性能监控的端点,用于集成其它的监控工具
配置环境
<dependency>
    <groupId>org.springframework.boot</groupId>
    <artifactId>spring-boot-starter-web</artifactId>
</dependency>

<dependency>
    <groupId>org.springframework.boot</groupId>
    <artifactId>spring-boot-starter-actuator</artifactId>
</dependency>
Endpoints 介绍
Spring Boot 提供了所谓的 endpoints (下文翻译为端点)给外部来与应用程序进行访问和交互。
打比方来说,/health 端点 提供了关于应用健康情况的一些基础信息。/metrics 端点提供了一些有用的应用程序指标(JVM 内存使用、系统 CPU 使用等)。
这些 Actuator 模块本来就有的端点我们称之为原生端点。根据端点的作用的话,我们大概可以分为三大类:
- 应用配置类:获取应用程序中加载的应用配置、环境变量、自动化配置报告等与Spring Boot应用密切相关的配置类信息。
- 度量指标类:获取应用程序运行过程中用于监控的度量指标,比如:内存信息、线程池信息、HTTP请求统计等。
- 操作控制类:提供了对应用的关闭等操作类功能。
需要注意的就是:每一个端点都可以通过配置来单独禁用或者启动
注意:不同于Actuator 1.x,Actuator 2.x 的大多数端点默认被禁掉。 Actuator 2.x 中的默认端点增加了
/actuator前缀。默认暴露的两个端点为/actuator/health和/actuator/info
端点暴露配置
我们可以通过以下配置,来配置通过 JMX 和 HTTP 暴露的端点。
| Property | Default |
|---|---|
| management.endpoints.jmx.exposure.exclude | |
| management.endpoints.jmx.exposure.include | * |
| management.endpoints.web.exposure.exclude | |
| management.endpoints.web.exposure.include | info, health |
可以打开所有的监控点
management.endpoints.web.exposure.include=*
也可以选择打开部分,"*" 代表暴露所有的端点,如果指定多个端点,用 "," 分开
management.endpoints.web.exposure.exclude=beans,trace
Actuator 默认所有的监控点路径都在 /actuator/*,当然如果有需要这个路径也支持定制。
management.endpoints.web.base-path=/minitor
设置完重启后,再次访问地址就会变成 /minitor/*
按照如下配置:
management:
  endpoints:
    web:
      exposure:
        include: "*"
启动DEMO程序,访问 http://localhost:8080/actuator 查看暴露出来的端点
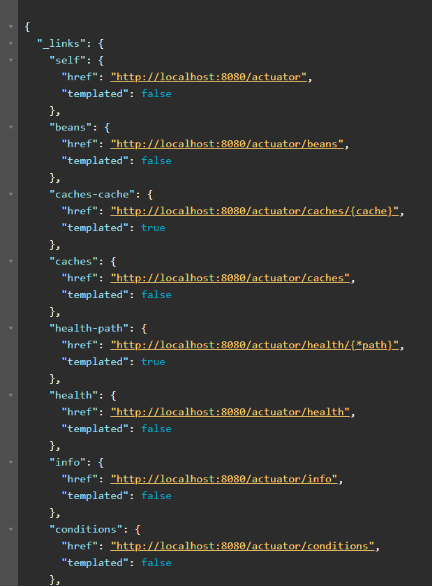
REST接口一览
Spring Boot Actuator 提供了非常丰富的监控接口,可以通过这些接口了解应用程序运行时的内部状况。Actuator 也支持用户自定义添加端点,可以根据实际应用,定义一些比较关心的指标,在运行期进行监控。
| HTTP方法 | 路径 | 描述 |
|---|---|---|
| GET | /auditevents | 显示当前应用程序的审计事件信息 |
| GET | /beans | 显示一个应用中所有Spring Beans的完整列表 |
| GET | /conditions | 显示配置类和自动配置类的状态及它们被应用或未被应用的原因。 |
| GET | /configprops | 显示一个所有 @ConfigurationProperties 的集合列表 |
| GET | /env | 显示来自Spring的ConfigurableEnvironment的属性。 |
| GET | /flyway | 显示数据库迁移路径,如果有的话。 |
| GET | /health | 显示应用的健康信息(当使用一个未认证连接访问时显示一个简单的“status”,使用认证连接访问则显示全部信息详情) |
| GET | /info | 显示任意的应用信息 |
| GET | /liquibase | 展示任何Liquibase数据库迁移路径,如果有的话 |
| GET | /metrics | 展示当前应用的metrics信息 |
| GET | /mappings | 显示一个所有@RequestMapping路径的集合列表 |
| GET | /scheduledtasks | 显示应用程序中的计划任务 |
| GET | /sessions | 允许从Spring会话支持的会话存储中检索和删除用户会话。使用 Spring Session 对反应性Web应用程序的支持时不可用。 |
| POST | /shutdown | 允许应用以优雅的方式关闭(默认情况下不启用) |
| GET | /threaddump | 执行一个线程dump |
如果使用 web 应用(Spring MVC, Spring WebFlux, 或者 Jersey),还可以使用以下接口:
| HTTP方法 | 路径 | 描述 |
|---|---|---|
| GET | /heapdump | 返回一个GZip压缩的hprof堆dump文件 |
| GET | /jolokia | 通过HTTP暴露JMX beans(当Jolokia在类路径上时,WebFlux不可用) |
| GET | /logfile | 返回日志文件内容(如果设置了 logging.file 或 logging.path 属性的话),支持使用 HTTP Range头接收日志文件内容的部分信息 |
| GET | /prometheus | 以可以被Prometheus服务器抓取的格式显示metrics信息 |
/health 端点
/health 端点会聚合你程序的健康指标,来检查程序的健康情况。端点公开的应用健康信息取决于:
该属性可以使用以下值之一进行配置:
| Name | Description |
|---|---|
| never | 不展示详细信息,up或者down的状态,默认配置 |
| when-authorized | 详细信息将会展示给通过认证的用户。授权的角色可以通过 management.endpoint.health.roles 配置 |
| always | 对所有用户暴露详细信息 |
当如上的组件有一个状态异常,应用服务的整体状态即为down。我们也可以通过配置禁用某个组件的健康监测。
management.health.mongo.enabled: false
或者禁用所有自动配置的健康指示器:
management.health.defaults.enabled: false
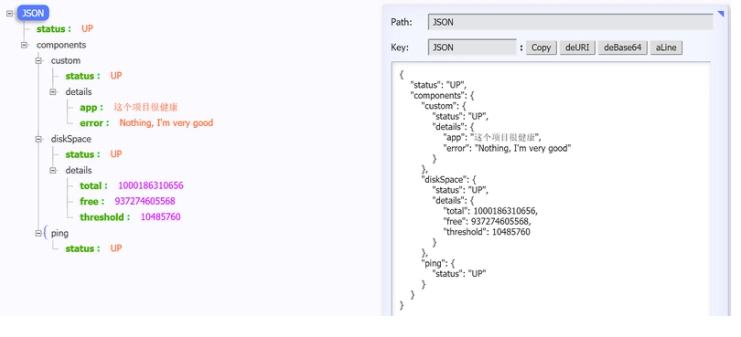
自定义 Health Indicator
可以自定义一个 Health Indicator,只需要实现 HealthIndicator 接口或者继承 AbstractHealthIndicator 类。
@Component
public class CustomHealthIndicator extends AbstractHealthIndicator {

    @Override
    protected void doHealthCheck(Health.Builder builder) throws Exception {
        // 使用 builder 来创建健康状态信息
        // 如果你 throw 了一个 exception,那么 status 就会被置为 DOWN,异常信息会被记录下来
        builder.up()
                .withDetail("app", "这个项目很健康")
                .withDetail("error", "Nothing, I'm very good");
    }
}
/metrics 端点
/metrics 端点用来返回当前应用的各类重要度量指标,比如:内存信息、线程信息、垃圾回收信息、tomcat、数据库连接池等。
{
    "names": [
        "tomcat.threads.busy",
        "jvm.threads.states",
        "jdbc.connections.active",
        "jvm.gc.memory.promoted",
        "http.server.requests",
        "hikaricp.connections.max",
        "hikaricp.connections.min",
        "jvm.memory.used",
        "jvm.gc.max.data.size",
        "jdbc.connections.max",
         ....
    ]
}
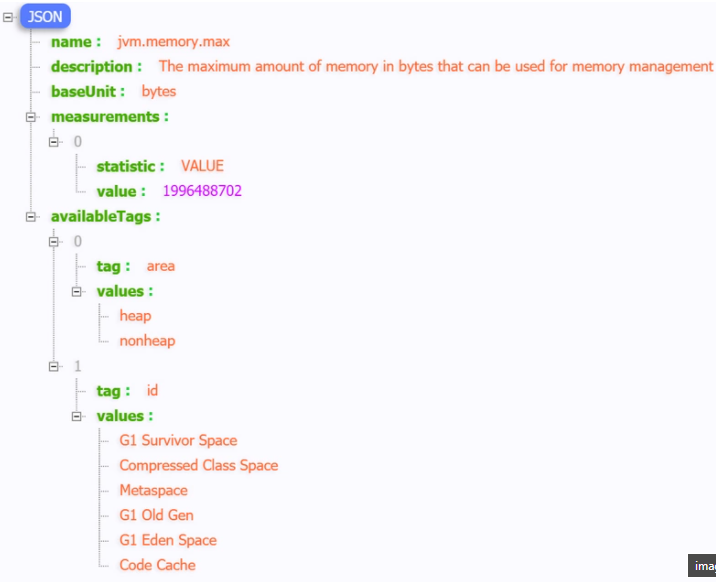
为了获取到某个指标的详细信息,我们可以请求具体的指标信息,像这样:
http://localhost:8080/actuator/metrics/{MetricName}
比如我访问 /actuator/metrics/jvm.memory.max,返回信息如下:
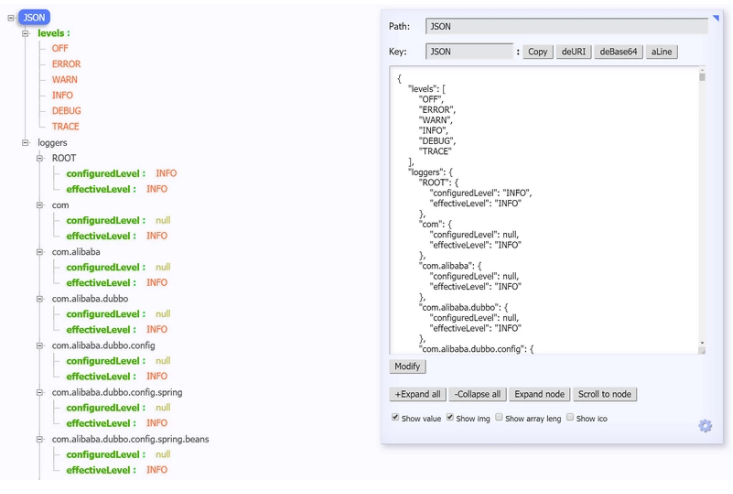
/loggers 端点
/loggers 端点暴露了我们程序内部配置的所有 logger 的信息。我们访问 /actuator/loggers 可以看到
你也可以通过下述方式访问单独一个logger
http://localhost:8080/actuator/loggers/{name}
改变运行时的日志等级
/loggers 端点我最想提的就是这个功能,能够动态修改你的日志等级。
比如,可以通过下述方式来修改 root logger的日志等级。
只需要发起一个URL 为 http://localhost:8080/actuator/loggers/root 的 POST 请求,POST报文如下:
{
   "configuredLevel": "DEBUG"
}
如果想重置成默认值,把value 改成 null
/info 端点
/info 端点可以用来展示程序的信息。就是一些程序的基础信息。并且可以按照自己的需求在配置文件 application.properties 中个性化配置(默认情况下,该端点只会返回一个空的json内容。):
info.app.name=actuator-test-demo
info.app.encoding=UTF-8
info.app.java.source=1.8
info.app.java.target=1.8
# 在 maven 项目中你可以直接用下列方式引用 maven properties的值
# info.app.encoding=@project.build.sourceEncoding@
# info.app.java.source=@java.version@
# info.app.java.target=@java.version@
启动项目,访问
http://localhost:8080/actuator/info
{
    "app": {
        "encoding": "UTF-8",
        "java": {
            "source": "1.8.0_131",
            "target": "1.8.0_131"
        },
        "name": "actuator-test-demo"
    }
}
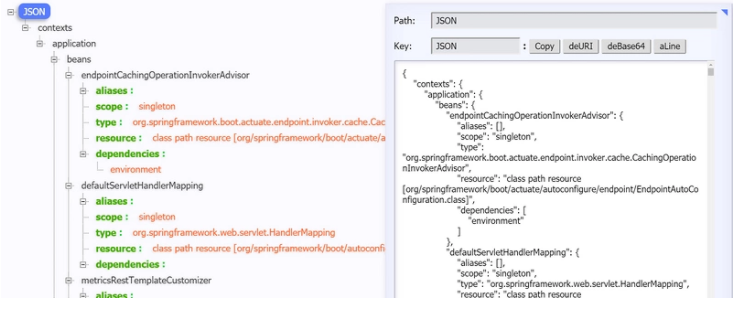
/beans 端点
/beans 端点会返回 Spring 容器中所有 bean 的别名、类型、是否单例、依赖等信息。
访问 http://localhost:8080/actuator/beans 返回如下:
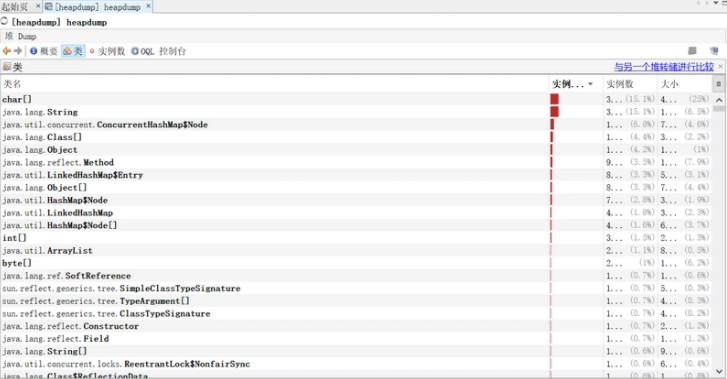
/heapdump 端点
访问:http://localhost:8080/actuator/heapdump 会自动生成一个 Jvm 的堆文件 heapdump。我们可以使用 JDK 自带的 Jvm 监控工具 VisualVM 打开此文件查看内存快照。
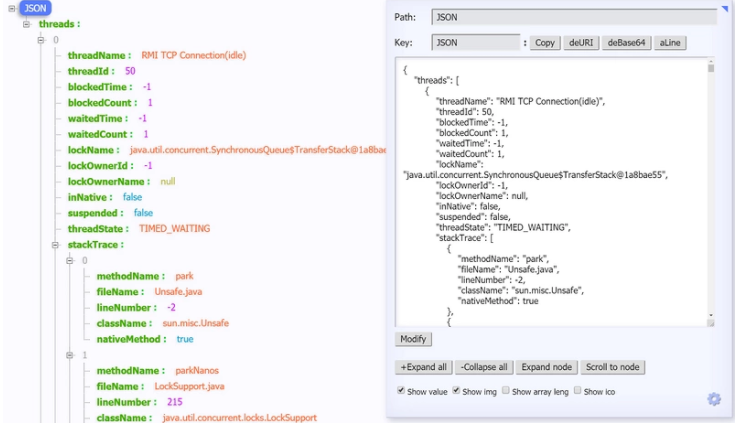
/threaddump 端点
它主要展示了线程名、线程ID、线程的状态、是否等待锁资源、线程堆栈等信息。就是可能查看起来不太直观。访问
http://localhost:8080/actuator/threaddump 返回如下:
整合 Spring Security 对端点进行安全校验
由于端点的信息和产生的交互都是非常敏感的,必须防止未经授权的外部访问。如果应用程序中存在 Spring Security 的依赖,则默认情况下使用基于表单的HTTP身份验证来保护端点。
如果没有,只需要增加对应的依赖即可:
<dependency>
   <groupId>org.springframework.boot</groupId>
   <artifactId>spring-boot-starter-security</artifactId>
</dependency>
添加之后,我们需要定义安全校验规则,来覆盖 Spring Security 的默认配置。
下面给出了两个版本的模板配置:
@Configuration
public class ActuatorSecurityConfig extends WebSecurityConfigurerAdapter {

    /*
     * version1:
     * 1. 限制 '/shutdown'端点的访问,只允许ACTUATOR_ADMIN访问
     * 2. 允许外部访问其他的端点
     * 3. 允许外部访问静态资源
     * 4. 允许外部访问 '/'
     * 5. 其他的访问需要被校验
     * version2:
     * 1. 限制所有端点的访问,只允许ACTUATOR_ADMIN访问
     * 2. 允许外部访问静态资源
     * 3. 允许外部访问 '/'
     * 4. 其他的访问需要被校验
     */

    @Override
    protected void configure(HttpSecurity http) throws Exception {
        // version1
//        http
//                .authorizeRequests()
//                    .requestMatchers(EndpointRequest.to(ShutdownEndpoint.class))
//                        .hasRole("ACTUATOR_ADMIN")
//                .requestMatchers(EndpointRequest.toAnyEndpoint())
//                    .permitAll()
//                .requestMatchers(PathRequest.toStaticResources().atCommonLocations())
//                    .permitAll()
//                .antMatchers("/")
//                    .permitAll()
//                .antMatchers("/**")
//                    .authenticated()
//                .and()
//                .httpBasic();

        // version2
        http
                .authorizeRequests()
                .requestMatchers(EndpointRequest.toAnyEndpoint())
                    .hasRole("ACTUATOR_ADMIN")
                .requestMatchers(PathRequest.toStaticResources().atCommonLocations())
                    .permitAll()
                .antMatchers("/")
                    .permitAll()
                .antMatchers("/**")
                    .authenticated()
                .and()
                .httpBasic();
    }
}
application.properties 的相关配置如下:
# Spring Security Default user name and password
spring.security.user.name=actuator
spring.security.user.password=actuator
spring.security.user.roles=ACTUATOR_ADMIN